About the project
Previously, I had completed a data visualization for my Google Data Analytics capstone project after completing a Federica Fragapane data viz course.
Proud of my new talents, and the job I just landed as a healthcare data analyst, I shared my project with my aunt, who spent her life as a marine biologist.
She has been embedded in the scientific research space for decades, surrounded by data visualizations, charts, graphs, and her work has taken her to many countries across the globe, to study their large bodies of water.
While I was expecting a pat on the back for my efforts, what she gave was the complete opposite. In her email back, she served up many constructive criticisms. She was honest in her feedback, no sugar-coating. Looking back, I am grateful for her feedback, as I used it as an opportunity to grow, improve, and learn about accessibility and its vital role in data visualization design.
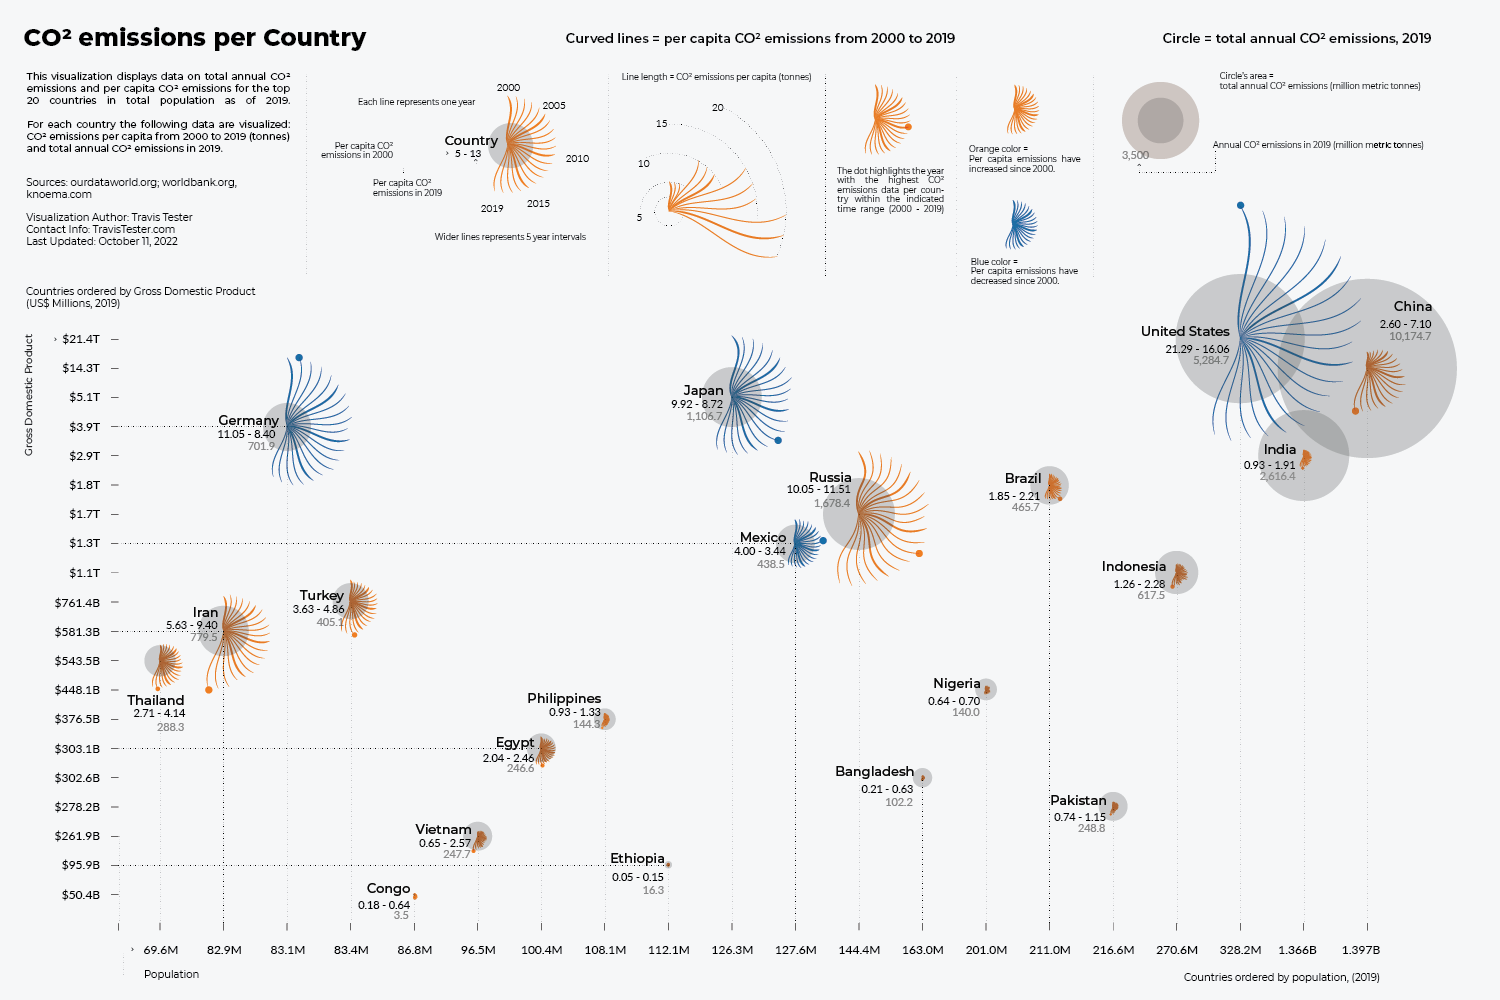
Taking into consideration her suggestion, I reworked the visual.
Below you will find the latest version, which has accessible color palettes for the visually impaired, more readable fonts, and a host of other design improvements.
Additionally, if you would like to read her feedback, I have included in here in my Behance portfolio, so you can compare and contrast.
Project results
The original version of this project was the first piece in my portfolio that I submitted with my resume to land a job as a data analyst. It has even picked up to be included in a data visualization book coming out this winter. I learned a lot from my aunt's suggestions and revisiting this project, mainly:
- There are color-blind friendly color palettes
- There are dyslexic-friendly fonts, and fonts best for displaying numbers in data visualization.
- To keep accessible best practices for data visualization at the front of your mind while you data viz, not the back.


